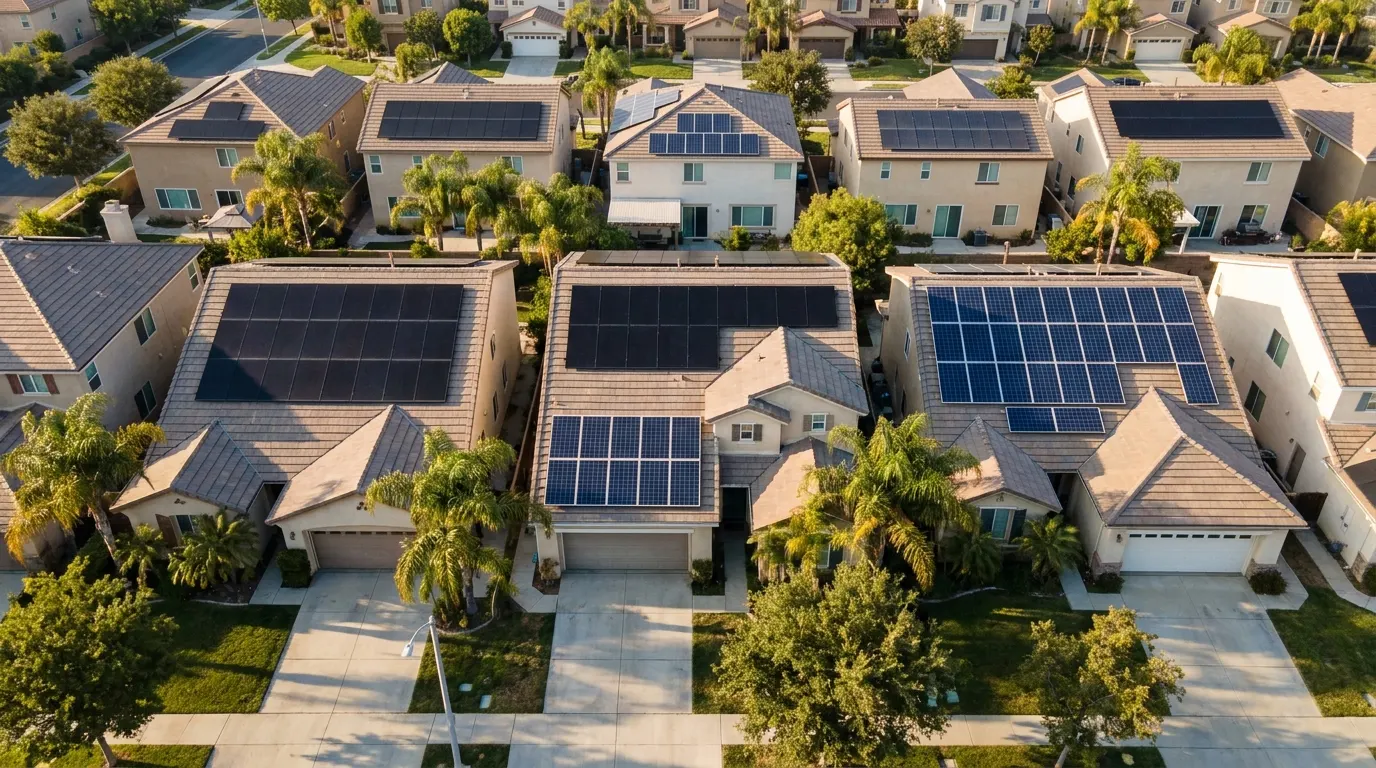
Most “best solar panel brands” lists are opinions: a writer picks ten brands and ranks them by efficiency or warranty. This one counts what went on roofs. We looked at the panel brand recorded for 666,142 home solar systems installed in 2023–2025, from the public installation records utilities and state agencies send to Lawrence Berkeley National Laboratory (Tracking the Sun). They are the same records behind our city rankings of solar installers.
One caveat up front: the records cover 15 states, and 80% of the systems are in California. Where the rest of the country differs, we show it separately.
The short answer
| # | Panel brand | Share, 2023–2025 | Share, 2025 |
|---|---|---|---|
| 1 | Qcells | 29.6% | 31.4% |
| 2 | JA Solar | 11.3% | 12.6% |
| 3 | REC | 8.0% | 8.5% |
| 4 | SunPower / Maxeon | 6.7% | 3.2% |
| 5 | LONGi | 6.5% | 8.8% |
| 6 | Canadian Solar | 6.3% | 4.5% |
| 7 | Silfab | 4.3% | 4.9% |
| 8 | Panasonic | 2.4% | 1.4% |
| 9 | Trina Solar | 2.2% | 3.6% |
| 10 | JinkoSolar | 2.2% | 3.5% |
| 11 | Tesla | 1.6% | — |
| 12 | Waaree | 1.6% | — |
Share of home systems with a recorded panel brand. A dash means the brand fell out of the 2025 top 15.
Qcells is the clear leader: almost one in three home systems, more than twice the next brand, and first in most states. After that the market is split among a dozen brands, and the order changes a lot from year to year.
Outside California the ranking looks a little different: Qcells still leads (28%), but REC is second (14%), followed by Silfab (8%), SunPower (4%), JinkoSolar (4%) and Trina Solar (4%).
How the market changed since 2015

| Brand | 2015 | 2019 | 2021 | 2023 | 2025 |
|---|---|---|---|---|---|
| Qcells | 5.7% | 24.0% | 22.3% | 27.9% | 31.4% |
| JA Solar | 0.0% | 0.4% | 1.2% | 10.1% | 12.6% |
| REC | 15.0% | 7.0% | 6.7% | 7.6% | 8.5% |
| SunPower / Maxeon | 10.3% | 11.0% | 14.2% | 9.5% | 3.2% |
| LG | 6.9% | 13.1% | 12.0% | 1.3% | 0.8% |
| LONGi | 0.0% | 4.4% | 15.2% | 5.1% | 8.8% |
Four stories stand out:
- Qcells went from 6% to about a quarter of the market between 2015 and 2019 and has kept growing since, to 31% in 2025.
- LG disappeared. It was on 13% of home systems in 2019 and 2020, then LG Electronics left the solar panel business in 2022. By 2025 it was under 1%. If you own LG panels, the warranty now depends on LG’s commitment to honor it after leaving the market.
- SunPower collapsed. SunPower (panels made by Maxeon since the 2020 spin-off) peaked at 14% in 2021 and fell to 3% in 2025. The company filed for bankruptcy in 2024; our guide on what SunPower owners can do now covers warranties and service.
- JA Solar rose from almost nothing to second place, mostly through one customer: Sunrun, the largest leasing company (see below). LONGi, its other big supplier, swings with Sunrun’s purchases too.
What homeowners paid by panel brand
Median price for systems the homeowner bought outright, before incentives, 2023–2025. Only brands with at least 1,000 priced systems.
| Panel brand | Median price per watt | Typical system | With a battery |
|---|---|---|---|
| LONGi | $3.56 | 4.7 kW | 21% |
| Panasonic | $3.60 | 7.4 kW | 23% |
| United Renewable Energy | $3.75 | 6.8 kW | 13% |
| JA Solar | $3.88 | 5.5 kW | 21% |
| Tesla | $3.90 | 8.8 kW | 65% |
| REC | $4.09 | 8.0 kW | 30% |
| Hyundai | $4.15 | 7.4 kW | 28% |
| JinkoSolar | $4.23 | 7.6 kW | 22% |
| All brands | $4.25 | ||
| Qcells | $4.25 | 6.5 kW | 22% |
| SunPower / Maxeon | $4.25 | 5.8 kW | 14% |
| Aptos Solar | $4.27 | 7.0 kW | 16% |
| Silfab | $4.44 | 7.2 kW | 24% |
| Waaree | $4.50 | 6.4 kW | 12% |
| Canadian Solar | $4.73 | 6.8 kW | 24% |
Don’t read this as “LONGi panels are cheap.” A panel is only a small part of a home system’s price; the rest is labor, permits, sales and the installer’s margin, and the price includes the battery when there is one. The gaps mostly reflect who installs each brand and where. Tesla, for example, sells its own panels on large systems at a low price per watt even though two in three come with a Powerwall.
The useful comparison is between your own quotes, per watt and against what homeowners in your city paid. Our city rankings show that median for over 100 cities, and our solar cost guide explains what drives it.
The brand often depends on how you pay
| Panel brand | Leased or on a PPA |
|---|---|
| JA Solar | 73% |
| LONGi | 57% |
| Trina Solar | 54% |
| JinkoSolar | 41% |
| Canadian Solar | 37% |
| Silfab | 34% |
| Qcells | 33% |
| SunPower / Maxeon | 10% |
| REC | 7% |
| Panasonic | 1% |
If you lease or sign a power purchase agreement, the leasing company chooses the equipment, and it buys in bulk. Sunrun, the largest, used JA Solar on 47% of its systems in 2023–2025, LONGi on 17% and Qcells on 13%. Buyers who pay cash or take a loan are far more likely to end up with REC, Panasonic or SunPower. More on the trade-off in solar lease vs. buy.
What the biggest installers put on roofs
| Installer | Main panel brands | Main inverter |
|---|---|---|
| Sunrun | JA Solar 47%, LONGi 17%, Qcells 13% | SolarEdge 51% |
| SunPower | SunPower / Maxeon 45%, Qcells 39% | Enphase 64% |
| Tesla Energy | Qcells 54%, Tesla 31% | Tesla 86% |
| Freedom Forever | Own-brand panels 28%, Qcells 19%, JinkoSolar 17% | SolarEdge 75% |
| Semper Solaris | Silfab 37%, Qcells 30% | Enphase 74% |
| Trinity Solar | Qcells 100% | SolarEdge 94% |
Share of each installer’s home systems in 2023–2025 with a recorded brand.
Most installers stick to one or two brands, so choosing an installer largely chooses the panel. If you want a specific brand, ask for it before you sign and check the model on the contract; some installers will switch brands depending on stock.
The top brand in each state
| State | Years | Top panel brand | Top inverter |
|---|---|---|---|
| Arizona | 2022–2024 | Qcells (26%) | Enphase (47%) |
| California | 2023–2025 | Qcells (30%) | Enphase (48%) |
| Colorado | 2021–2023 | Qcells (23%) | — |
| Maine | 2023–2025 | Qcells (26%) | SolarEdge (50%) |
| Minnesota | 2021–2023 | Qcells (23%) | — |
| New Mexico | 2022–2024 | Qcells (25%) | — |
| New York | 2023–2025 | Qcells (41%) | Enphase (58%) |
| Texas | 2022–2024 | Mission Solar (16%) | Enphase (52%) |
| Vermont | 2023–2025 | Qcells (36%) | Enphase (47%) |
| Washington, D.C. | 2023–2025 | Canadian Solar (22%) | Enphase (51%) |
| Wisconsin | 2023–2025 | REC (26%) | — |
The latest three complete years of records in each state with at least 1,000 systems with a recorded brand. A dash means too few systems recorded the inverter. Texas is the exception worth noting: its records, mostly from San Antonio and Austin, favor Mission Solar, a panel maker based in San Antonio.
Inverters: Enphase overtook SolarEdge, and Tesla is catching up
The inverter matters as much as the panel for how a system behaves when something fails, and two companies made most of them. In 2015 they were even, with about a quarter of home systems each (25.4% for Enphase, 26.2% for SolarEdge). SolarEdge then pulled ahead, to 58.7% in 2019, and Enphase passed it in 2022. In 2025 Tesla jumped to 36%, because its Powerwall 3 battery has a solar inverter built in, so a home that adds one doesn’t need a separate inverter.

| Inverter | 2019 | 2021 | 2023 | 2024 | 2025 |
|---|---|---|---|---|---|
| Enphase | 20.8% | 37.9% | 51.6% | 52.3% | 38.2% |
| SolarEdge | 58.7% | 41.7% | 31.9% | 26.6% | 18.6% |
| Tesla | 0.0% | 3.1% | 4.4% | 11.2% | 35.9% |
| SunPower | 9.0% | 11.4% | 6.4% | 2.1% | 1.1% |
Enphase puts a microinverter under each panel: if one fails, you lose one panel, and the monitoring app shows which. SolarEdge uses one inverter on the wall plus an optimizer on each panel: if the inverter fails, the whole system stops. Tesla’s Powerwall 3 works like a string inverter with a battery inside: one box runs the panels and the storage. SunPower’s own-brand microinverters were made by Enphase under a supply deal signed in 2018.
Owned systems with Enphase microinverters had a median price of $4.06 per watt in 2023–2025, against $4.44 for SolarEdge and $4.41 for Tesla, whose price includes the battery on 71% of systems. SolarEdge dominates leasing: 55% of SolarEdge systems were leased or on a PPA, against 21% of Enphase systems.
If your system has stopped producing, our troubleshooting guide walks through the checks for each type before you call anyone.
How to use this when you choose
- Brand share is not a quality score. It shows what installers could buy at a good price and trust enough to put on thousands of roofs. A brand on 20% of systems is at least a proven, available product.
- Look at the warranty holder, not just the warranty length. Panel and inverter warranties come from the manufacturer and survive an installer bankruptcy, which has happened a lot lately: see our list of solar companies that went out of business. A 25-year warranty is only as good as the company behind it.
- Compare price per watt, then brand. Two quotes with different panels are comparable if you divide each total by the system size in watts, and take the battery out first. Your city’s page shows what local homeowners paid.
- If you lease, ask which panels and inverter you will get. The leasing company decides, and the contract should name the models.
Where these numbers come from
Tracking the Sun, Lawrence Berkeley National Laboratory (2026 edition, records through 2025), licensed CC BY 4.0. We counted home systems on existing houses, excluding self-installed systems and new construction, and grouped a brand’s variant names together (for example, “Hanwha Q CELLS” and “Qcells”). Shares are of systems with a recorded brand; prices are medians for owned systems with a plausible price per watt. Fewer 2024 and 2025 systems are in the records so far, because some utilities report late.
Frequently Asked Questions
What is the most popular solar panel brand in the U.S.?
Qcells. In the public installation records for 2023–2025, Qcells panels went on 29.6% of home solar systems with a recorded brand, more than twice the next brand, JA Solar (11.3%). Qcells also led in 2025 alone (31.4%) and was the top brand in most states with records.
Which solar panel brand is the cheapest to install?
Among brands with at least 1,000 priced systems in 2023–2025, homes with LONGi panels paid the lowest median price, $3.56 per watt, followed by Panasonic ($3.60) and JA Solar ($3.88). Canadian Solar systems had the highest median, $4.73 per watt. The installer, the system size and whether a battery was included explain most of the gap, not the panel itself.
Which panel brands do solar leasing companies use?
Mostly JA Solar and LONGi. 73% of the systems with JA Solar panels and 57% of those with LONGi panels were leased or on a power purchase agreement, against 7% for REC and 1% for Panasonic. Sunrun, the largest leasing company, used JA Solar on 47% of its systems in 2023–2025.
Is Enphase or SolarEdge more common?
Enphase, since 2022. Enphase microinverters were on 49% of the home systems with a recorded inverter in 2023–2025, against 27% for SolarEdge. In 2025 the second place went to Tesla (36%), whose Powerwall 3 battery has a solar inverter built in.
Does the panel brand matter if my installer goes out of business?
Yes. The panel warranty comes from the manufacturer, not the installer, so it survives an installer bankruptcy as long as the manufacturer is still in business. That is one reason to prefer a brand with a long track record in the U.S. market.